Paper PnL vs Real — what TheWhiteWhaleHL actually made on this Hyperliquid ETH long
Lookonchain reported @TheWhiteWhaleHL up $30M on his Hyperliquid ETH long. The chain says he exited at $19.95M. Of that $10M gap, only $1.37M was explicit friction — $108,994 in fees and $1,266,886 in funding. The other $8.63M melted between the peak screenshot and the actual fills that closed.
The trade — what was claimed vs what the chain recorded
TheWhiteWhaleHL is a directional whale on Hyperliquid, not a bot farm or a market-maker. By mid-2025 he was running four sub-accounts in parallel, mostly ETH and SOL longs, with hold periods measured in weeks or months. Lookonchain tracks him.
On July 20, 2025, Lookonchain posted:
TheWhiteWhaleHL’s net unrealized profit reached ~$30M across ETH and SOL longs by July 20, 2025.
That snapshot captured the peak. ETH had been running hard since early July and his position was fully marked-to-market at the high. The number is real — it’s what his account showed at that moment in time, before a single closing fill was executed.
This audit is scoped to the largest of his wallets (0xfa6af…1e13e). The ETH long opened in early July 2025 and was fully wound down by October 15. That is nearly three and a half months of continuous exposure — entry builds across 10,503 fills, exits across 6,093 fills, and 197 funding events collected or paid throughout the hold. Our audit does not aggregate cross-wallet; the numbers below are this wallet only.
| Value | |
|---|---|
| Wallet | 0xfa6af…1e13e |
| Asset | ETH |
| Direction | Long |
| Window | 2025-07-01 to 2025-10-15 |
| Entry fills | 10,503 |
| Exit fills | 6,093 |
| Hold | ~3 months |
| Funding events | 197 |
Note that TheWhiteWhaleHL operated four wallets concurrently during this period per Lookonchain’s reporting. The $30M peak figure spans all wallets and assets. Our $19.95M realized figure is strictly this one wallet’s ETH position.
The two layers of paper-vs-real
When a trader’s peak unrealized number doesn’t match what they actually realized, the gap usually has two distinct sources. Most discussions conflate them, which obscures where the money actually went. Here we separate them cleanly.
Layer 1 — Unrealized melt ($10M)
The $30M Lookonchain screenshot was taken on July 20, at ETH’s local peak. TheWhiteWhaleHL did not exit on July 20. He held — through July, through August, through September — and when he finally wound down the position in October, ETH had retraced from that July high. His realized close came in at $19.95M.
That $10M difference is not a trading error. It is not fees or funding. It is simply the difference between the price at which the position was marked when the screenshot was taken and the price at which the position was actually closed. Had he closed on July 20 exactly, the $30M would have been real. He didn’t. He held three more months, and by the time he closed, the marks had moved.
This is the mechanism that makes peak screenshots systematically misleading. A screenshot captures a single mark in time — open positions valued at current mid. It captures maximum optimism. The realized number is what you actually extract when you sell into a live market with real bids. For a position this size, that process takes days of careful unwinding, not a single market order at the theoretical mid.
The $30M was his real unrealized equity at that moment. But most traders who see that headline number do not mentally discount for the hold risk between “peak paper” and “actual close.” They pattern-match to “this person made $30M” and that number sticks. The realized exit of $19.95M — which is the number that actually landed in his wallet — gets far less attention.
This is the core behavioral problem the Paper PnL vs Real series is designed to surface. Your PnL chart on Hyperliquid shows you your unrealized mark in real time. It is not lying to you. But it is not the same as your realized return, and for long holds with meaningful retracements, the gap between the two can easily be measured in millions.
Layer 2 — The friction our tool surfaces ($1.37M)
The $10M unrealized melt is invisible to any audit tool. It is simply price action. What an audit tool can measure is the explicit friction: the money paid out in fees and funding that comes directly off your realized exit. For this trade, that came to $1,375,880 in total.
Fees: $108,995.
Across 16,596 total fills (10,503 entries plus 6,093 exits), the net fee paid was $108,995. This is a signed figure — Hyperliquid’s maker rebate is negative, meaning if you’re posting liquidity you actually receive a small credit against your fees. The audit sums the signed fee on every fill using Hyperliquid’s maker/taker schedule and nets it. At this scale and fill pattern, the gross taker fees are partially offset by maker rebates on the entry leg, but the net is still nearly $109K.
For context on how Hyperliquid’s fee schedule works — including when makers receive rebates and how the tier thresholds shift at large notional — see How Hyperliquid liquidations actually work, which covers the fee structure alongside the margin mechanics.
$109K sounds large until you run the percentage: it’s 0.55% of $19.95M realized. For a position held over 10,000 fills across three months, that is genuinely efficient execution. Fees are not the story here.
Funding: $1,266,886.
This is the story.
197 funding events over three months. ETH longs on Hyperliquid pay funding when the perpetual is trading at a premium to the index — which it was through most of the July-August rally, precisely when TheWhiteWhaleHL was accumulating. Long-side funding demand was high, the perp was in contango, and he was on the paying side of every 8-hour settlement.
At the notional size this wallet was running — estimates from the fill data put the working ETH notional between $50M and $80M through peak exposure — the 8-hour funding increments add up quickly. $1,266,886 over 197 events works out to roughly $6,430 per event on average, which is consistent with a large long position in a positively-funded perp.
The critical number is this: $1.27M is 6.35% of his $19.95M realized exit. Not 6.35% of the paper claim. 6.35% of the actual cash he extracted from the position. If his internal PnL tracking was “exit price minus entry price,” funding never appeared in that calculation at all. It settled to a separate ledger — Hyperliquid’s own accounting separates closedPnl from funding transfers, and most retail PnL displays show the position PnL without the funding ledger aggregated in.
That means a trader could look at his Hyperliquid dashboard, see a $19.95M realized PnL figure on the position itself, and think his real profit was $19.95M. The $1.27M in funding paid sits in a different line item, quiet.
This is why journal-level tracking matters. Funding is not a rounding error. At 6.35% of realized, it is not a footnote. It is a cost center.
The waterfall
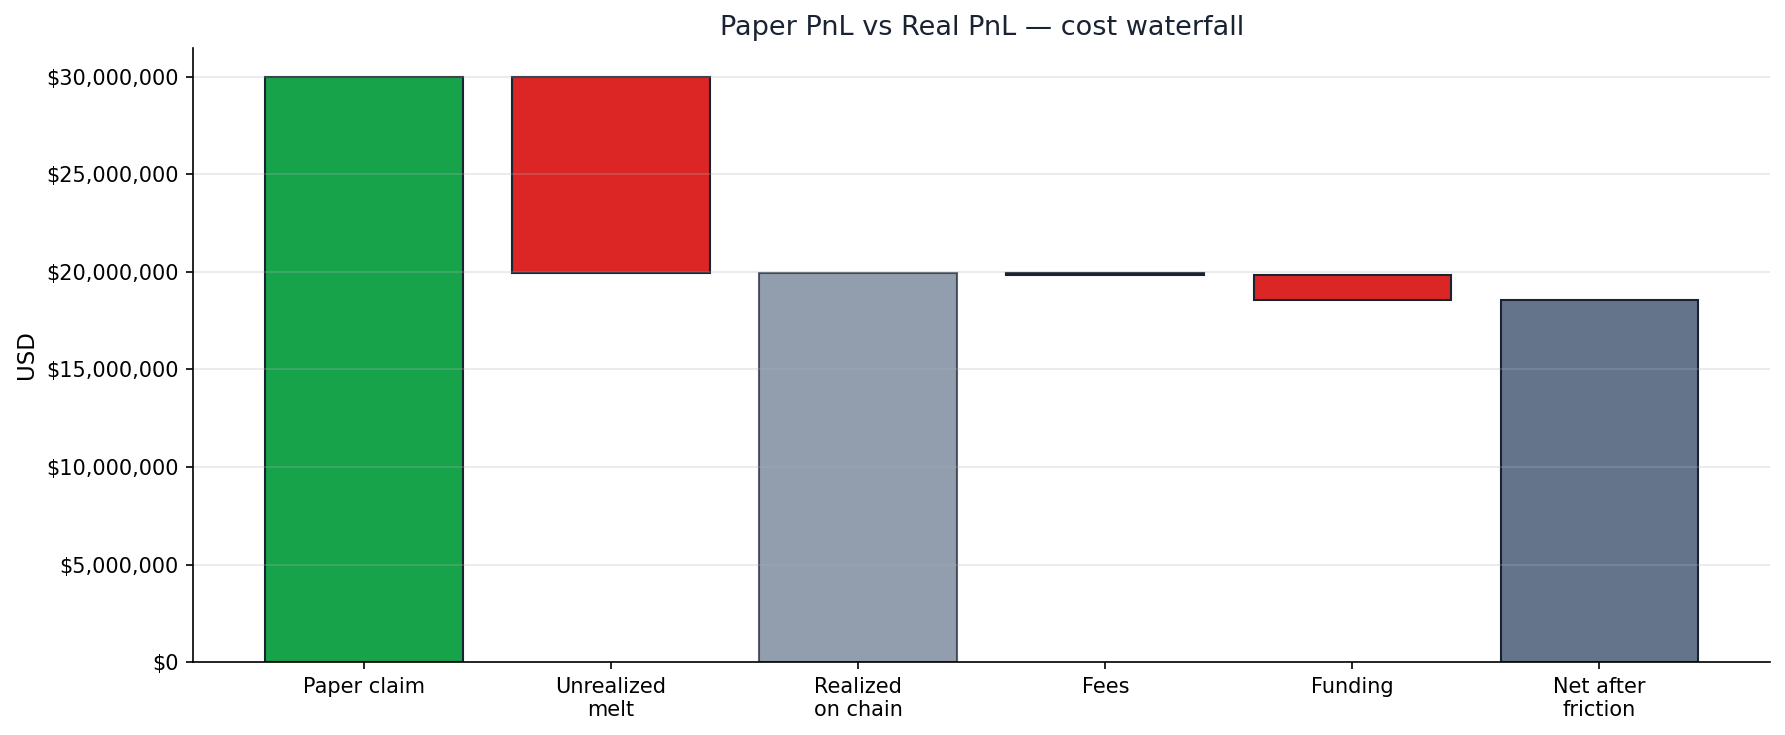
Cost waterfall for the audited ETH long. Slippage is excluded — 1-minute candle granularity is inadequate for the thousands of sub-second fills in this trade; the methodology section explains.
The position peaked at the Lookonchain-reported $30M. By October when he actually closed, realized was $19.95M — $10M of peak had just melted back. Then $109K in net fees and $1.27M in funding on top. Net: $18.57M.
| Component | Amount |
|---|---|
| Paper claim (peak) | $30,000,000 |
| Realized on chain (closedPnl) | $19,948,100 |
| Fees | −$108,995 |
| Funding | −$1,266,886 |
| Net after friction | $18,572,219 |
| Total gap (paper − net) | $11,427,781 (38%) |
The 38% gap between the $30M headline and the $18.57M net is the real scorecard of this trade.
Methodology
Data sources. All on-chain data was fetched from Hyperliquid’s public Info API. Entry and exit fills were pulled via userFillsByTime, paginated with the API’s rate-limit-compliant cursor. Funding events came from userFunding, with amounts extracted from the nested delta.usdc field. Realized PnL was summed from Hyperliquid’s own closedPnl value per fill — this is the exchange’s own accounting of realized gain or loss at each closing fill, net of Hyperliquid’s internal fee treatment.
Fee computation. Fees are summed as signed values. Hyperliquid’s maker rebate is reported as a negative fee (the trader receives it). The audit does not flip this sign — maker rebates correctly reduce the total fee burden. The net $108,995 is after all maker rebates are credited.
Funding computation. Funding amounts from the API carry the exchange’s sign convention: positive means the trader received, negative means the trader paid. The audit flips this to cost convention — positive cost means the position paid funding out. The $1,266,886 figure means the long paid that amount net over 197 events.
Realized PnL. The $19,948,100 figure is the sum of closedPnl across all closing fills in the window. It reflects Hyperliquid’s own accounting per fill and includes the exchange’s internal handling of fees in its PnL attribution. It is not independently re-derived from entry price minus exit price.
Slippage explicitly excluded. The Hyperliquid Info API’s finest public price granularity is 1-minute candles. The audited trade executed over 16,000 fills — many at sub-second intervals, orders of magnitude faster than candle resolution. Computing per-fill slippage against 1-minute candle mid prices produced a figure with the sign reversed and a magnitude consistent with a methodology artifact rather than actual market impact. We dropped slippage entirely from the headline figures. Future episodes may supplement with orderbook L2 snapshots where available.
Scope disclaimer. This audit covers one wallet only. TheWhiteWhaleHL ran at least four sub-accounts in parallel during July 2025, per Lookonchain’s own aggregation. The $30M peak figure Lookonchain reported was cross-wallet and cross-asset. Our $19.95M realized figure is strictly the ETH position in wallet 0xfa6af…1e13e; cross-wallet aggregates are out of scope and would require separate audits of each sub-account.
Reproducibility. The full script is open-source: github.com/liugangdao/paper-vs-real-pnl. Clone it and point it at any public Hyperliquid wallet to run your own audit. The fixture file locks the exact numbers used in this article to the run from 2026-04-17.
Last verified: 2026-04-17.
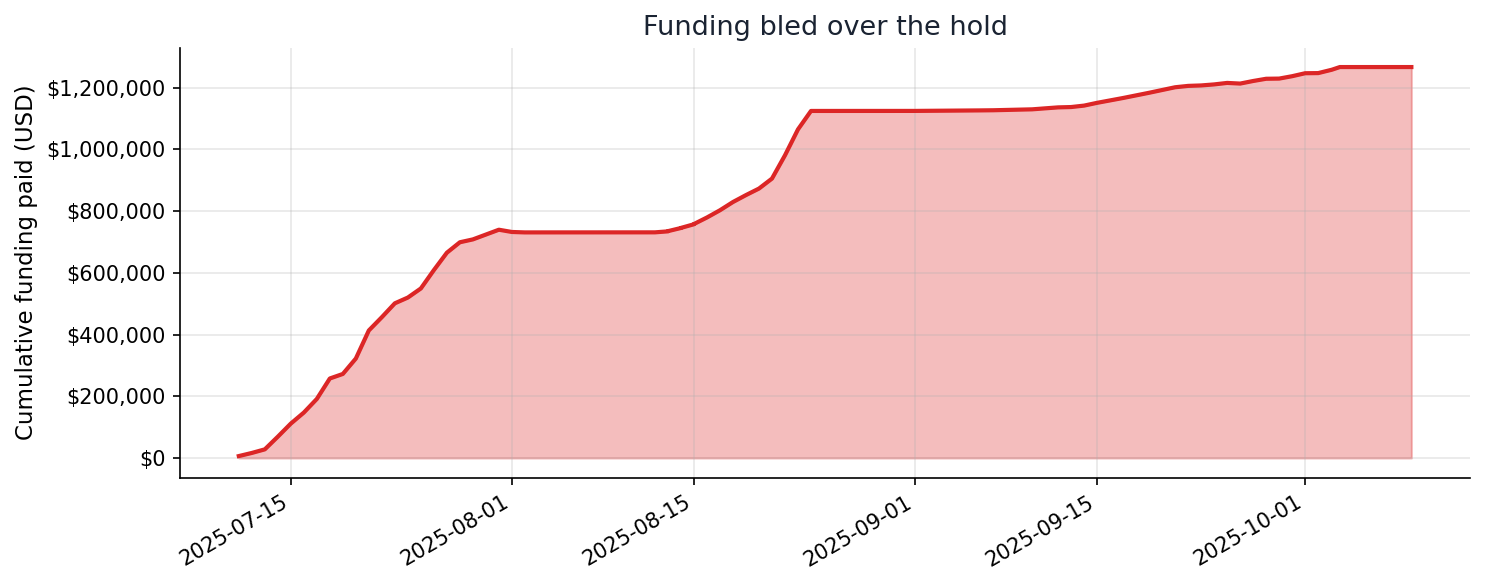
Funding bled steadily. 197 events over 3 months at ~8-hour cadence.
What this means for your account
This audit isn’t a takedown — $19M realized on a 3-month directional call is an excellent outcome. The point is that even a trade this successful bleeds $1.27M to funding alone, and most traders don’t track that line at all.
Two things worth internalizing:
Your unrealized PnL is not your return. It’s your return if you close right now. The $30M Lookonchain screenshotted was TheWhiteWhaleHL’s real unrealized equity in that moment. It was never anything he could spend. Keep a realized column. Update it only when you actually close.
Funding is a real cost, not a dashboard footnote. A 3-month ETH long in a positively-funded perp environment will accrue meaningful funding drain. At retail sizes the percentage is often worse, not better — same rate, smaller notional, same 6%+ drag. At a $100K account, that’s the difference between a 15% return and a 9% one. That’s not a footnote.
The tools that help:
- Hyperliquid liquidation calculator — size positions knowing your actual margin cushion and how funding eats it over time.
- Hyperliquid mechanics guide — the full cost structure, including how funding interacts with margin and liquidation price.
- Try the open-source trading journal — free, self-hostable — tracks funding, borrow, fees, and realized PnL as separate columns. Because they are separate costs.
- Clone the script and audit your own trades — point it at any public Hyperliquid wallet. No API key required.